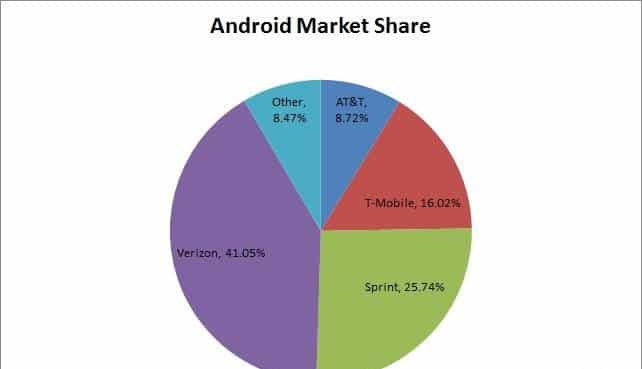
Ten years after launching, the Android company announced it had reached a global user base of 1 billion. Four years later, the number of Android-powered monthly active devices increased to 2 billion which explains more than 2.8 million apps on the Google Play store. This feat could not have been possible without the increased interest of the mobile devices manufacturers and the public at large.
As Android OS improves, so do devices where it is installed. For instance, between 2010 and 2012, Samsung Galaxy S was the bestselling Android smartphone model with about 20 million devices sold worldwide.
This South Korean company has been dominating the smartphone market between 2013 and 2017. In 2012, Chinese manufacturer Xiaomi hijacked the market with its well accepted Xiaomi X2 model which sold as much as 10 million units the same year.
Considering the high price tag of Apple’s devices, one might think that most Android users tend to be people with lower income and standard of living. However, surveys reveal the opposite – there are more Android users with $75,000 yearly income than those who are earning less than $30,000.
With the vast array of apps available for Android users, they are using smartphones now more than ever. About 88% of respondents said they had been regularly using their devices in the bathroom. But wait; there is more. These users are also believed to tap on their devices approximately 2,617 times a day.
What else could be expected from people who have no less than 35 apps installed on their devices on average? It’s no wonder that about 1,743 apps are downloaded from the Google Play Store every second.
For more intriguing information, check out the interesting infographic below which showcases mind-blowing stats about Android OS, its user base, and their preferences and rate of use.


